
ILEC Observations
Whole Life vs Universal Life
Introduction
Monitoring industry experience (mortality, morbidity, lapses) is a key
objective for Munich Re’s North American biometric research team.
We hope to stimulate discussions with our business partners and
across the insurance industry by sharing our key findings. We believe
these discussions will lead to a better understanding of the emerging
experience and its importance in assessing the underlying risk.
This paper is the third in a series looking at the data provided by
the most recent Individual Life Insurance Mortality Report from
the Individual Life Experience Committee (ILEC) of the Society of
Actuaries. However, this paper is the first to include the latest 2014-15
calendar year ILEC data, which supplemented the prior 2009-13 study.
Earlier papers explored preferred wear-o, post-level term mortality
(click here) and variation in the underlying experience by the number
of preferred classes and type of product (click here). This paper will
further expand upon experience by product type, with a specific
focus on universal life and how it compares to its term and whole life
predecessors. Before diving into the experience, it is important to
be familiar with the history of these products and to understand the
market conditions during the time period when they were sold and
why they appealed to so many policyholders.
MUNICH RE LIFE US

ILEC Observations – Whole Life vs Universal Life 2/4
© 2019 Munich American Reassurance Company, Atlanta, Georgia
The Rise of Universal Life
Life insurance companies experienced a diicult period
during the late 1970s and early 1980s when the United
States was experiencing a period of historically high
interest rates.
1
At the time, yields on new investments
were significantly higher than the portfolio rates credited
on whole life cash value products. Policyholders began
surrendering their whole life products in order to invest
the cash value in the high yielding bond market.
2
This, in
turn, put downward pressure on term premium rates as
these same policyholders replaced their whole life coverage
with term insurance, materially increasing the number
of new applications in the term insurance market. In
order to maintain market share, companies repriced their
term products on a continual basis, with rates spiraling
downward. Term lapse rates began to rise significantly as
healthy individuals were re-underwritten each year in order
to take advantage of the new, lower premium rates.
3
Insurance companies became concerned that there would
be a significant shift in invested assets from cash value
insurance products to the financial markets, potentially
leading to liquidity and solvency pressures.
4
This is the genesis of the universal life (UL) product. At the
time, it was seen as a potential solution to these market
conditions. As a hybrid product, it combined the benefits
of illustrating high investment returns with charging
competitive term insurance rates in the early years.
4
Compared to whole life, the universal life design was touted
widely as being “transparent,” where the policyowner could
see all the factors that determined their UL account value:
premiums received, interest credited, deductions from
premium loads, administrative fees and cost of insurance
(COI) charges.
5
Furthermore, UL insurers were able to
illustrate using rates of interest significantly higher than the
dividend interest rates embedded in whole life policies in the
early 1980s. As such, market share quickly began to migrate
from whole life to universal life, as shown in Graph 1.
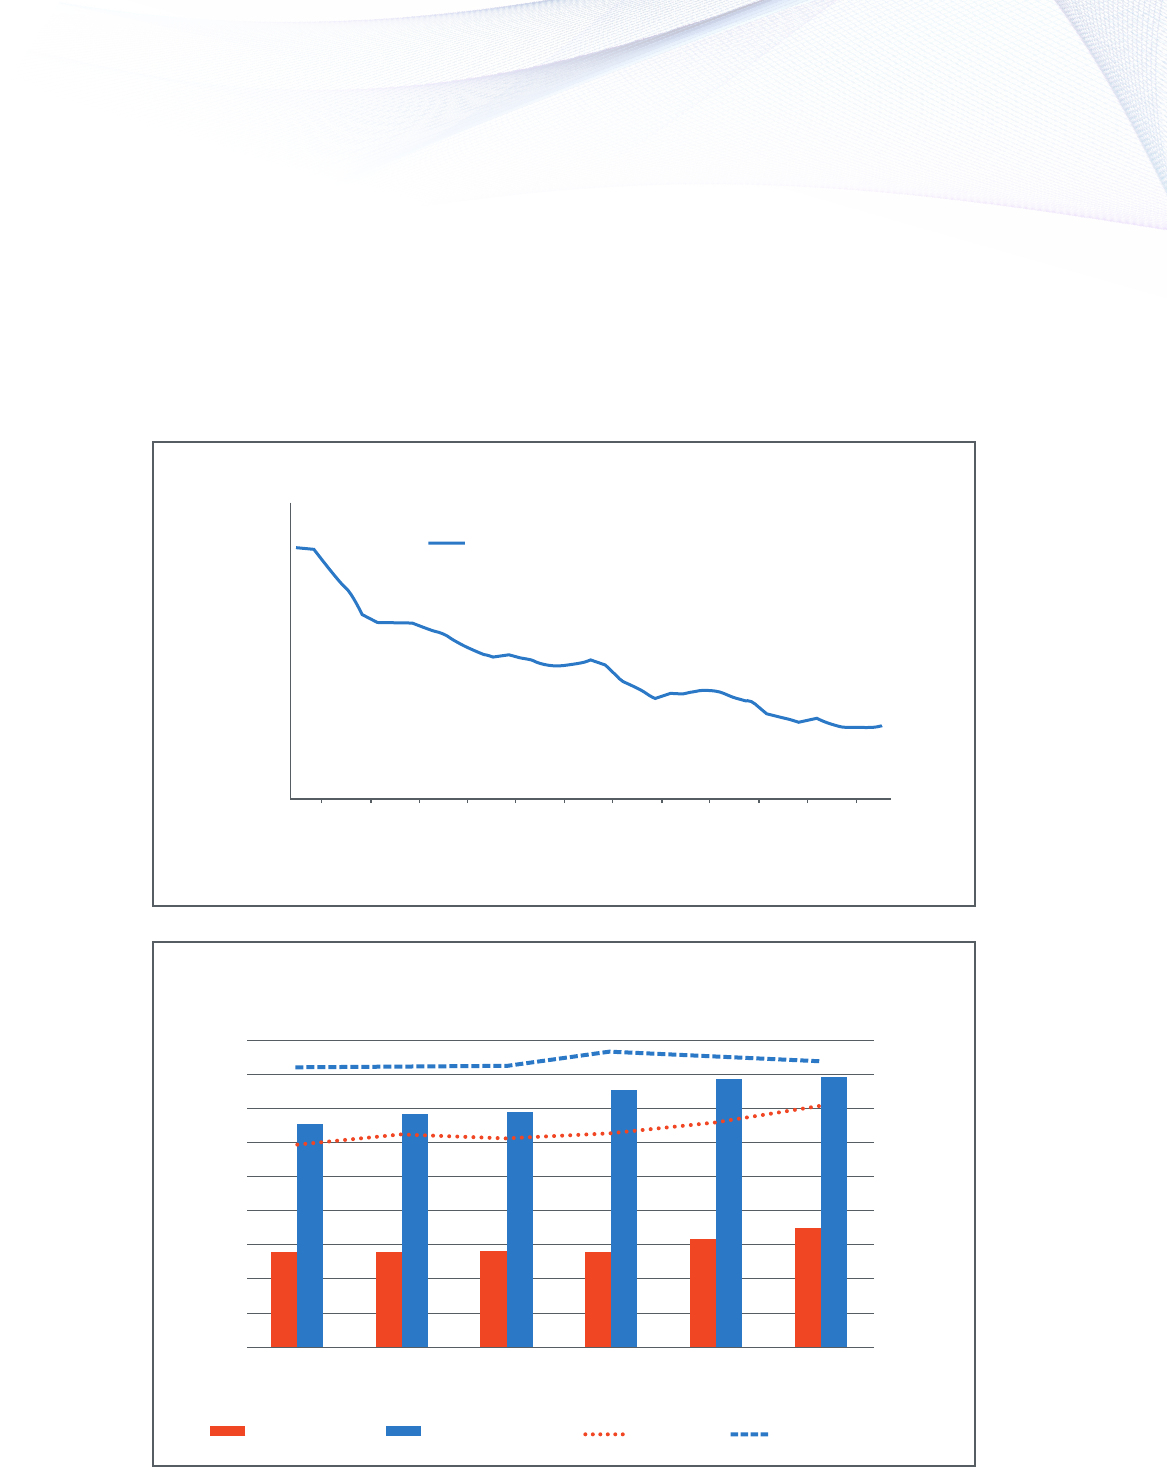
Several years later, as interest rates began to decline
in the mid 1980s, so did the non-guaranteed returns
of the universal life policies. Eventually, earned rates
reached the guaranteed minimum rates specified in these
policies, which were approximately 4-5%
5
(see Graph 2).
Account values started to deviate significantly from policy
illustrations. In addition, the investment returns on the
account values were not enough to cover the increases in
cost of insurance charges, and policyholders were required
to pay substantially more premiums in order to keep the
policies in force.
6
This resulted in reputational challenges
for the life insurance industry including multiple “class
action lawsuits and individual litigation claiming the
insurance companies had used unrealistic projections of
future interest rates in their illustrations.”
7
This led to lower
persistency and subsequent deterioration in mortality
experience for life insurance companies.
Persistency and Mortality
In our proprietary studies, we have observed that lapse
experience for these first-generation universal life products,
sold in the 1980s and 1990s, has been higher than lapse
experience on whole life products. While whole life lapses
Percent of New Business
New Money Rate
100% –
90% –
80% –
70% –
60% –
50% –
40% –
30% –
20% –
10% –
0% –
– 16.0%
– 14.0%
– 12.0%
– 10.0%
– 8.0%
– 6.0%
– 4.0%
– 2.0%
– 0.0%
Graph 1: Sales by Product vs New Money Rates
UL Variable Term WL AAA Corporate Bond Yield
1976
1977
1978
1979
1980
1981
1982
1983
1984
1985
1986
1987
1988
1989
Sources: U.S. Individual Life Insurance Sale Trends, 1975-2013, LIMRA Insurance Research, September 2014
Moody‘s AAA Corporate Bond Yield, Board of Governors of the Federal Reserve System (3 year moving average)
ILEC Observations – Whole Life vs Universal Life 3/4
© 2019 Munich American Reassurance Company, Atlanta, Georgia
trend down towards an ultimate lapse rate, the higher
universal life lapse experience starts as early as duration 10
for some portfolios and continues to increase as time goes
on. This timing is not surprising, given that a UL surrender
charge ”generally declines to zero over 10 to 15 years and
allows the insurer to recover first year commissions and
other acquisition expenses out of subsequent margins.”
5
Concurrent with this lapse deviation, we also observed
a corresponding increase in UL mortality that can be
approximated using Duke’s MacDonald methods where the
anti-selective lapse factor is set equal to the excess of the
universal life lapse rates over the whole life lapse rates with
a near 100% eectiveness assumption.
This same phenomenon continues into later durations and
can be observed in the 2009-2015 ILEC data. Graph 3 shows
the mortality A/E for universal life and whole life products
for key insurance ages from the 1984-1989 sales cohort.
8
Source: Moody‘s AAA Corporate Bond Yield, Board of Governors of the Federal Reserve System (3 year moving average)
16.0% –
14.0% –
12.0% –
10.0% –
8.0% –
6.0% –
4.0% –
2.0% –
0.0% –
Graph 2
Graph 3
Male 100K-2,499K IA 30-59, IY 1984-89
1982
1985
1988
1991
1994
1997
2000
2003
2006
2009
2012
2015
2018
Year
Yield
Lapse Rate by Count
AE(VBT15) by Count
Duration
9.0%
8.0%
7.0%
6.0%
5.0%
4.0%
3.0%
2.0%
1.0%
0.0%
120.0%
100.0%
80.0%
60.0%
40.0%
20.0%
0.0%
26 27 28 29 30 31
WL Lapse Rate UL&VL Lapse Rate WL A/E(#) UL&VL A/E(#)
AAA Corporate Bond Yield

ILEC Observations – Whole Life vs Universal Life 4/4
© 2019 Munich American Reassurance Company, Atlanta, Georgia
Industry Response and Today
Since the time of the first-generation universal life
products, many innovative product designs have entered
the universal life market, such as the no-lapse guarantee
(NLG) feature. In addition, illustration regulations were
introduced to inform and protect life insurance consumers,
thereby making the current sales environment much
dierent than it had been in the past. We anticipate that
these changes will flow through to policyholder behavior.
For example, we do not see, and would not expect to see,
the same lapse and mortality deterioration to emerge in
NLG universal life product experience as we saw in the
earlier UL products.
However, questions remain. First-generation universal
life products were sold with returns on account values on
the order of 10%
7
with contractual guaranteed minimum
earned rates on the order of 5%. Currently, many UL
products have a guaranteed minimum earned rate of
approximately 1%. Would illustrations of 6% tempt fate
to repeat the poor experience of the first generation ULs
if actual investment returns significantly underperform
such illustrations?
Conclusion
We have outlined some of the experience variation that
could be useful in setting mortality assumptions for WL
and UL products. The ILEC data is a valuable source
of recently emerged industry experience. However, a
significant heterogeneity of the data should be taken into
account by any user in their own work. Actuaries should
also try to understand the drivers in the historic data so
that they can use sound judgement when setting best
estimate assumptions for future business.
It is also important to keep in mind that policyholder
behavior is very much influenced by external forces.
So, while we can gather valuable insight from historical
experience, it should be only one of many factors taken into
consideration when setting assumptions.
Again, we believe that sharing some of our findings will
stimulate further discussion and will lead to better under-
standing of the key drivers behind emerged experience.
Note: The ILEC data files can be found at https://www.
soa.org/resources/research-reports/2019/2009-2015-
individual-life-mortality/
References
1. The US Prime rate hit a record high of 21.50% on December 19th 1980.
http://www.fedprimerate.com/wall_street_journal_prime_rate_history.htm
2. Transactions of Society of Actuaries, 1980, Vol. 32, Pricing a Select
and Ultimate Annual Renewable Term Product, Jeery Dukes &
Andrew M. MacDonald. https://www.soa.org/globalassets/assets/
library/research/transactions-of-society-of-actuaries/1980/january/
tsa80v3216.pdf
3. Record of Society of Actuaries, 1985, Vol. 11, No. 1, New Developments –
Term Insurance, https://www.soa.org/library/proceedings/record-of-
the-society-of-actuaries/1980-89/1985/january/RSA85V11N119.pdf
4. A Brief History of Universal Life, Douglas C. Doll, The Universal
Life Study Note, https://www.soa.org/globalassets/assets/library/
monographs/50th-anniversary/product-development-section/1999/
january/m-as99-3-06.pdf
5. Further Observations on Life Insurance, James H. Hunt, 2013,
https://consumerfed.org/pdfs/Evaluate-June-2013.pdf
6. Universal Life Insurance, a 1980s Sensation Has Backfired, Leslie
Scism, The Wall Street Journal, https://www.wsj.com/articles/universal-
life-insurance-a-1980s-sensation-has-backfired-1537368656
7. The Financial Basis for No Lapse Universal Life Insurance, Academy
of Financial Services, 2010 Annual Meeting, Lise Graham & David R.
Lange, https://academyoinancialservices.wildapricot.org/resources/
Documents/Proceedings/2010/4A-Graham-Lange.pdf
8. Although the ILEC study is a mortality study and not a lapse study, we
have calculated implied lapse rates based on changes in the exposures.
The results are consistent with what we observe in proprietary studies.
Tim Morant
FSA, MAAA
VP & Actuary,
Biometric Research
Munich Re Life US
Lisa Seeman
FSA, MAAA
2nd VP & Actuary,
Biometric Research
Munich Re Life US
